Two Powerful Aftermarket Datasets that Drive Competitive Advantage
November 17, 2023
Two Powerful Aftermarket Datasets that Drive Competitive Advantage
Contributed by the Auto Care Association

In today’s fast-paced and ever-evolving automotive aftermarket, staying ahead of the curve has become more crucial than ever. Whether you’re a manufacturer, distributor, or service provider, the industry’s landscape is marked by fierce competition, rapidly changing consumer preferences, and technological advancements that demand adaptation. Amidst this dynamic environment, one resource has emerged as a game-changer: data.
Auto Care Association continues to evolve its exclusive, interactive data platform, TrendLens and the Demand Index tool housed within to enable companies like yours to obtain insights not available anywhere else.
TrendLens enables aftermarket companies like yours to understand how nearly 50 market influencing factors are affecting the industry and your business. Demand Index is the only tool that provides hard part and other parts performance data for nearly 100 product categories from point of sales transactions from the top retail and commercial distribution businesses.
Here are the newest improvements.
Powerful Features
Indexed Comparison allows users to select economic and industry indicator data points and track their movement from the same starting point.
• Bonus: This syncs with point-of-sale data, so Demand Index users can compare movement of category sales data to economic and industry indicator data points.
• Application: Users can benchmark difference indices against one another without scaling. Units are removed and relative movement between indicators of interest can be easily visualized for tracking purposes.
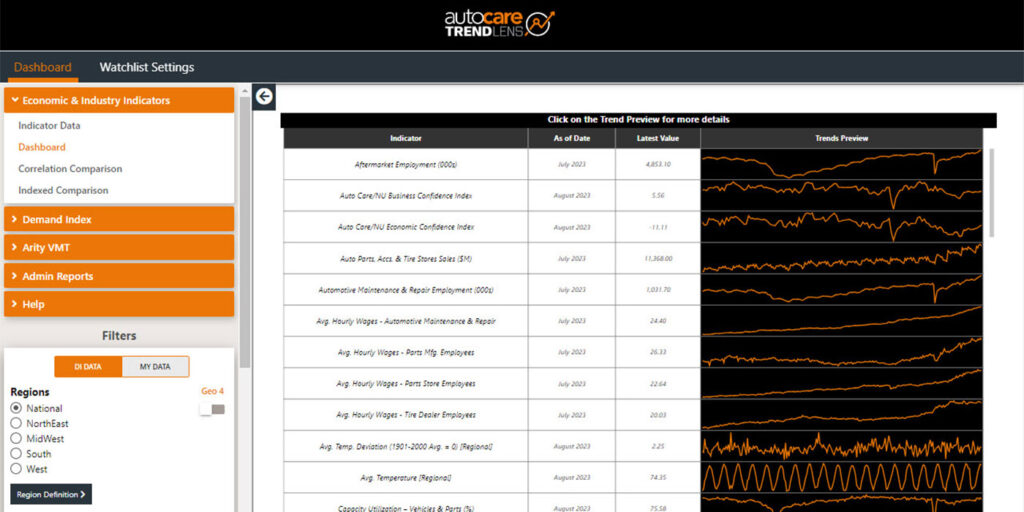
Dashboard allows users to view separate plots for multiple indicators.
• Bonus: Demand Index and Arity Vehicle Miles Traveled (VMT) can be viewed alongside economic and industry indicator data to look for patterns and identify potential leading indicators.
• Application: Members can look at a wide array of data to identify leading indicators of company performance.
Correlation Comparison lets users quantify the level of correlation between any two data points, whether Arity (monthly), economic and industry indicators or Demand Index
• Bonus: Use the multi-point correlation feature to test the correlation of one variable to all others that you have access to.
• APPLICATION: Choose leading indicators that are relevant to your business with conviction based on statistical analysis, not just gut instinct.